
After my friend and probably others too, complaining the extraordinary heat at KL last Feb and March (and probably April too?), I've extracted this NCEP/NCAR reanalysis data and made the anomaly analysis just to see whether there's temperature rise over KL early this year.
The graph showing us the difference between the average monthly and average of 30 years (1971-2000,climatology standard)...
.....which means, for the very first data in the first graph, is the air temp difference between average January 1971 and climatology average of January.
Note that, the temperature value analyzed is at 6UTC, or 2pm local time.
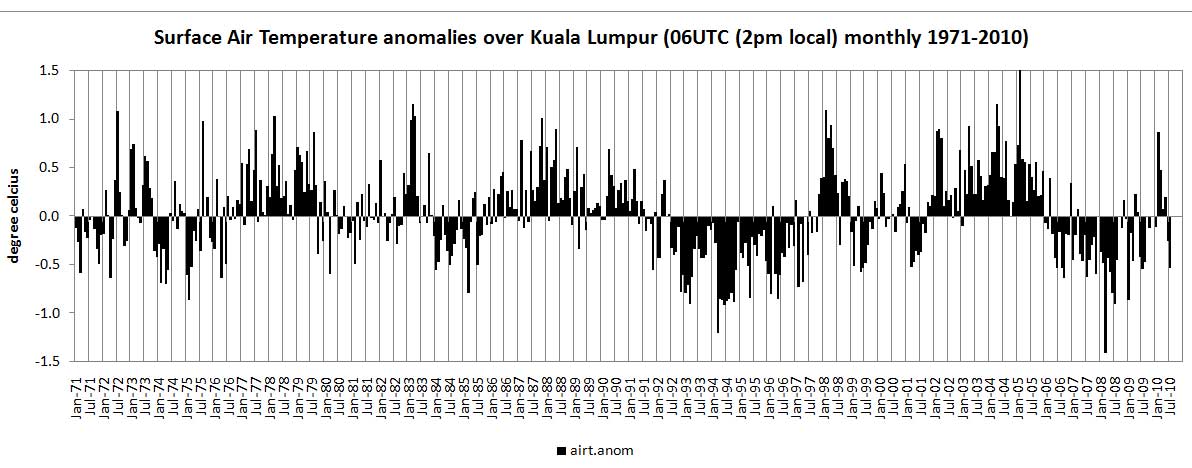
1.Average monthly anomalies (click for clear img) Air temperature anomalies over KL (monthly) from 1971-2010.
Climatology reference year is 1971-2000.
 Air temperature anomalies over KL (monthly) from 1971-2010.
Climatology reference year is 1971-2000.
2.Average monthly anomalies (2008-2010)..(click for clear img) Air temperature anomalies over KL, for 2008-2010. Marked in red is the area referring to Feb,Mar,Apr,May 0f 2010, where the temperature seemed over average. (sorry for double legend there, :)...)
 Air temperature anomalies over KL, for 2008-2010. Marked in red is the area referring to Feb,Mar,Apr,May 0f 2010, where the temperature seemed over average. (sorry for double legend there, :)...)
That's all I could write right now, `cause I need to get back to my work.
me: (!)this analysis is only for general information and not for decision making related to property protection,etc.
No comments:
Post a Comment